profiling.sampling — Statistical profiler — Python 3.16.0a0 documentation
Tin mới
profiling.tracing — Deterministic profiler
pstats — Statistics for profilers

What is statistical profiling?

The profiling.sampling module, named Tachyon, provides statistical profiling of Python programs through periodic stack sampling. Tachyon can run scripts directly or attach to any running Python process without requiring
timeit: Measure the execution time of small code snippets.
Statistical sampling is not ideal for every situation.
threading: Thread-based parallelism.
Python programs often use multiple threads, whether explicitly through the threading module or implicitly through libraries that manage thread pools.
multiprocessing: Process-based parallelism.
The --subprocesses option enables automatic profiling of subprocesses spawned by the target:
subprocess: Subprocess management.
The --subprocesses option enables automatic profiling of subprocesses spawned by the target:
The --subprocesses option enables automatic profiling of subprocesses spawned by the target:
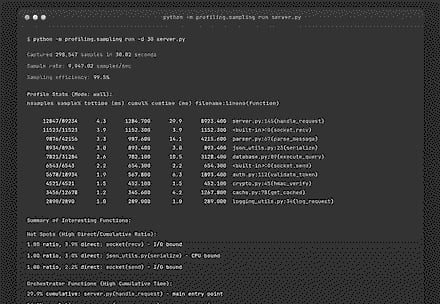
Tachyon pstats terminal output

The pstats format displays profiling results in a color-coded table showing function hotspots, sample counts, and timing estimates.
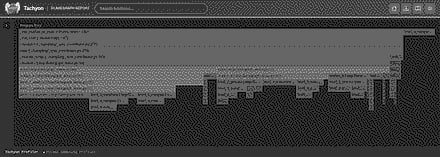
Tachyon interactive flame graph

The flame graph visualization shows call stacks as nested rectangles, with width proportional to time spent. The sidebar displays runtime statistics, GIL metrics, and hotspot functions.
Flame graph format (--flamegraph) produces a self-contained HTML file with an interactive flame graph visualization:
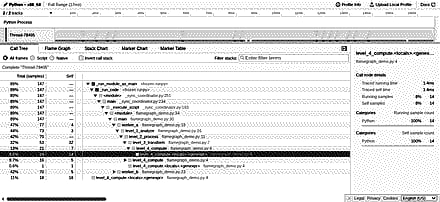
Firefox Profiler Call Tree view

The Call Tree view shows the complete call hierarchy with sample counts and percentages. The sidebar displays detailed statistics for the selected function including running time and sample distribution.
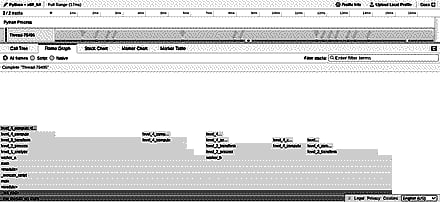
Firefox Profiler Flame Graph view

The Flame Graph visualization shows call stacks as nested rectangles. Functions names are visible in the call hierarchy.
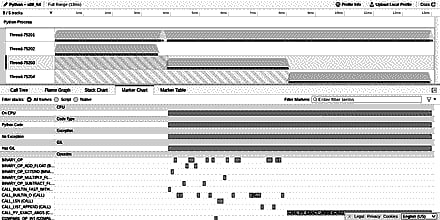
Firefox Profiler Marker Chart with opcodes

The Marker Chart displays interval markers including CPU state, GIL status, and opcodes. With --opcodes enabled, bytecode instructions like BINARY_OP_ADD_FLOAT, CALL_PY_EXACT_ARGS, and CALL_LIST_APPEND appear as markers


The heatmap overlays sample counts directly on your source code. Lines are color-coded from cool (few samples) to hot (many samples). Navigation buttons (▲▼) let you jump between callers and callees.
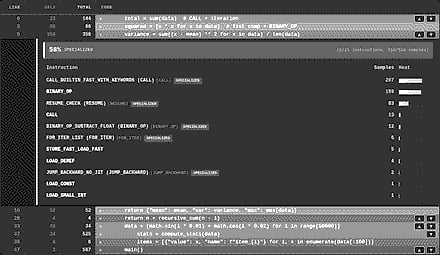
Heatmap with expanded bytecode panel

Expanding a hot line reveals the bytecode instructions executed, including specialized variants. The panel shows sample counts per instruction and the overall specialization percentage for the line.
Heatmap format (--heatmap) generates an interactive HTML visualization showing sample counts at the source line level:
compression.zstd: Low-level interface to compression and decompression routines in the zstd library.
zstd: Force zstd compression (requires compression.zstd support)
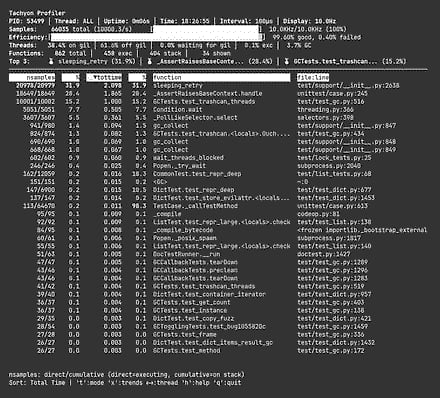
Tachyon live mode showing all threads

curses: An interface to the curses library, providing portable terminal handling.
Live mode (--live) provides a terminal-based real-time view of profiling data, similar to the top command for system processes:

Tachyon live mode with opcode panel

For programs using asyncio, the profiler offers async-aware mode (--async-aware) that reconstructs call stacks based on the task structure rather than the raw Python frames: