numpy.random.RandomState.logistic — NumPy v2.6.dev0 Manual
method
random.RandomState.logistic(loc=0.0, scale=1.0, size=None)
Draw samples from a logistic distribution.
Samples are drawn from a logistic distribution with specified parameters, loc (location or mean, also median), and scale (>0).
Parameters:locfloat or array_like of floats, optionalParameter of the distribution. Default is 0.
scalefloat or array_like of floats, optionalParameter of the distribution. Must be non-negative. Default is 1.
sizeint or tuple of ints, optionalOutput shape. If the given shape is, e.g., (m,n,k), then m*n*k samples are drawn. If size is None (default), a single value is returned if loc and scale are both scalars. Otherwise, np.broadcast(loc,scale).size samples are drawn.
Returns:outndarray or scalarDrawn samples from the parameterized logistic distribution.
Notes
The probability density for the Logistic distribution is
\[P(x) = P(x) = \frac{e^{-(x-\mu)/s}}{s(1+e^{-(x-\mu)/s})^2},\]
where \(\mu\) = location and \(s\) = scale.
The Logistic distribution is used in Extreme Value problems where it can act as a mixture of Gumbel distributions, in Epidemiology, and by the World Chess Federation (FIDE) where it is used in the Elo ranking system, assuming the performance of each player is a logistically distributed random variable.
References
[1]
Reiss, R.-D. and Thomas M. (2001), “Statistical Analysis of Extreme Values, from Insurance, Finance, Hydrology and Other Fields,” Birkhauser Verlag, Basel, pp 132-133.
Examples
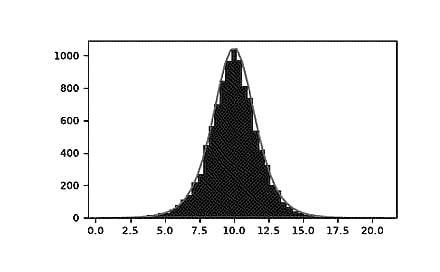
Draw samples from the distribution:
>>> loc,scale=10,1>>> s=np.random.logistic(loc,scale,10000)>>> importmatplotlib.pyplotasplt>>> count,bins,ignored=plt.hist(s,bins=50)# plot against distribution
>>> deflogist(x,loc,scale):... returnnp.exp((loc-x)/scale)/(scale*(1+np.exp((loc-x)/scale))**2)>>> lgst_val=logist(bins,loc,scale)>>> plt.plot(bins,lgst_val*count.max()/lgst_val.max())>>> plt.show()